WEEKLY MARKET SUMMARY
Global Equities: US equities shrugged off hotter-than-expected inflation and concerns over tariffs and delivered a solid weekly performance. The S&P 500 rode a 1.5% weekly gain and is now trading right around its prior all-time closing high, the Nasdaq led with a 2.6% weekly gain, and the Dow Jones Industrial Average remained positive with a 0.3% weekly advance. Small Cap stocks were laggards, ending the week flat over concerns of higher-for-longer interest rates following hot inflation data. Developed International stocks were also sharply higher for the week, gaining 2.9%, and have outperformed their domestic large cap peers year-to-date. Emerging markets also turned in a strong weekly gain, rising 2.8%.
Fixed Income: 10-Year Treasury yields ended slightly lower at 4.47%, following a mid-week spike to 4.65% in response to US inflation data. Fed Fund futures markets are pricing in just one 2025 rate cut, per data from CME Group’s FedWatch tool. US corporate bonds posted weekly gains, with Investment Grade bonds up 0.4% and High Yield bonds gaining 0.5%.
Commodities: US West Texas Intermediate (WTI) Crude prices were relatively unchanged, ending the week slightly higher at $71.50/barrel. The number of active US oil and gas rigs rose to 288, but remains lower from the same time last year, according to data from Baker Hughes. Gold prices tested the $3,000/oz level before dipping on Friday to end the week under $2,900.
WEEKLY ECONOMIC SUMMARY
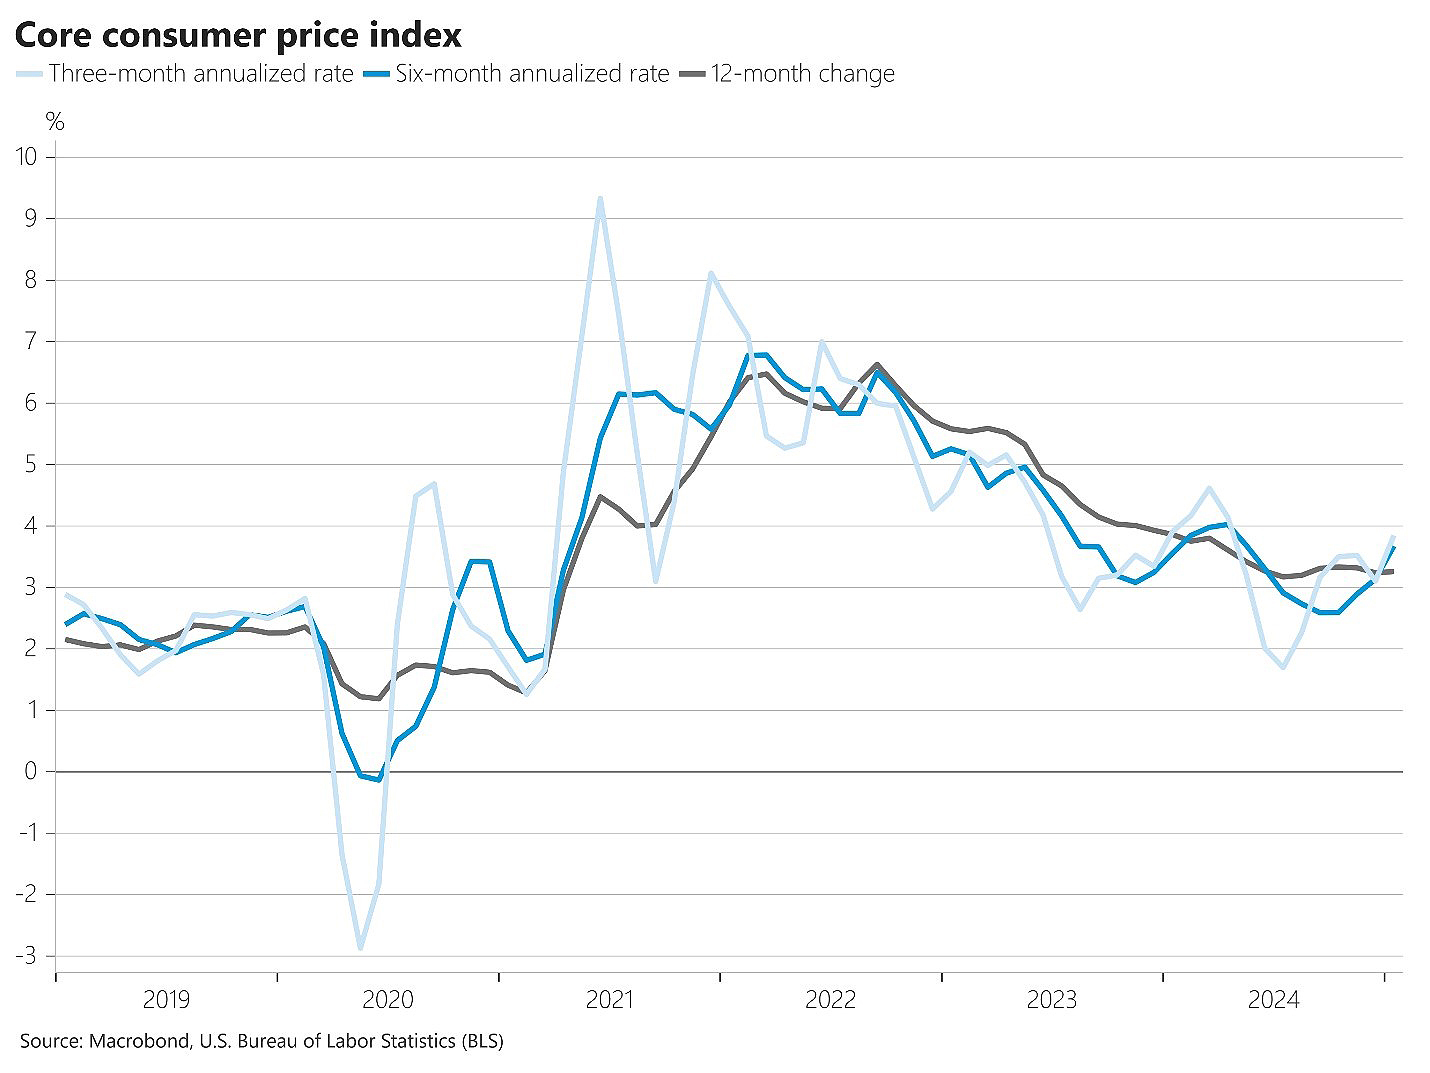
Hot Inflation: The latest Consumer Price Index (CPI) report on inflation highlighted the challenges facing the Federal Reserve after the data came in hotter than expected at 0.5% in January, bringing the annual rate of inflation up to 3%. Core CPI, excluding food and energy, was also higher than anticipated at 0.4% and is running at a 3.3% annual rate. Shelter, which has been the biggest contributor to inflation, remains stubbornly high at 4.4% annually and accelerated in January. The hot CPI report was followed by a similarly high Producer Price Index (PPI) report. PPI is considered a leading indicator and came in at 3.5% annually.
Powell Delivers Testimony: Fed Chair Jerome Powell delivered his testimony before Congress, reiterating the Fed’s recent stance that further progress on inflation will be required before the central bank can confidently resume rate cuts. Powell noted that the strength of the labor market has provided the Fed with the “luxury of being able to wait” for inflation to resume its downward trend. Powell also touched on the importance of Federal Reserve independence in response to criticism from the Trump administration.
Earnings Update: Earnings continue to mostly impress, with some big beats of note during the week. AppLovin (APP) was a big winner thanks to Artificial Intelligence integration and a proposed mobile gaming division spinoff. APP shares soared 27% after beating estimates. Coffee retailer Dutch Bros (BROS) also saw shares surge 24% on strong growth, while footwear maker Crocs (CROX) turned in another strong quarter and gained 18% after earnings. A little over three-quarters of the S&P 500 has now reported Q4 2024 earnings, and 76% of those companies have beaten EPS estimates.
CHART OF THE WEEK
The Chart of the Week shows the three-, six-, and twelve-month annualized rate of Core Consumer Price Index (CPI) inflation. Core CPI excludes food and energy and is similar to the Core Personal Consumption Expenditure Index which the Fed uses to measure inflation. Looking at the three- and six-month trends provides insight into present conditions, which appear to show inflation progress backsliding. However, there was a similar run of hot inflation at the beginning of 2024, so this could be a seasonal anomaly. We won’t know for sure for several months, which means that the Fed will almost certainly hold tight on rates. This doesn’t mean that the bull market in stocks is over, however, as strong earnings and US GDP growth could keep the market afloat until the Fed is ready to resume cuts.


